
Challenges presented by business valuations based on comparison to public companies
A common valuation technique is to study earnings multiples or other metrics from other transactions, and apply those measures to the subject company. So, we start with “Competitor X is valued at 10 times earnings” and conclude that the company’s value must be 10 times its earnings.
Those multiples frequently come from comparison to “Done Deals”–purchases and sales of all or substantially all of a company (usually, a competitor). In part 1 of this article, which can be found here, I outline the benefits and limitations to that approach.
In this article, I turn the focus to the other source for multiples: public markets. While purchases and sales of 100% interests in public companies are not particularly commonplace, minority interests in those companies trade frequently, often daily. That is, each time a share in a public company is bought and sold, the market can be said to be delivering a message as to the value of that share (which one would think bears some relationship to the value of the entire company–but more on this in a moment).
Reference to public market data overcomes some of the shortcomings of the “Done Deals” comparators discussed in Part 1 of this article. Briefly recapped, the major shortcomings are:
- A lack of activity: In some industries, there simply may have been no “done deals”. There might have been no buyouts of furniture manufacturers, auto rental agencies, widget manufacturers, etc. at the relevant time. If, however, the industry is represented in the public markets, then there was almost certainly a trade of at least some shares (not all listed companies trade daily, but barring an unusual event such as delisting, most trade on most days of the week);
- A lack of information on trades: Unlike private company “done deals”, if there was a trade, there will always be a fair volume of information on that trade (i.e. the trading price, the corporation’s recent earnings, and other information required to be in the public realm as a matter of course);
- Synergies built into the price: Transaction prices in “done deals” might be reflective of synergies for which the buyer was willing to pay. Synergies, however, are often very specific to a particular buyer and seller. Hence, multiples can be overstated as the present subject company and its potential buyers may not bear characteristics allowing for the same synergies.
Based on the above, one might be inclined to regard the public company multiples as necessarily superior. However, public company multiples present a separate set of challenges, which I present below.
Do public markets reflect “fair” market value?
“Fair market value” is the highest price obtainable in an open and unrestricted market, between informed and prudent parties, under no compulsion to transact, expressed in terms of money or money’s worth. The “fairness” supposes a market that works a certain way: one with intelligent buyers and sellers, acting rationally, based on facts and on a good information base.
When we rely on public market metrics, we are essentially saying that the market is a “fair market value market”. Whether this is true has been the subject of academic debate since…since there were markets. However, I would suggest that there is fairly broad consensus that markets that are illiquid–those of thinly traded stocks, for instance–are not fair. Illiquid assets trade at a discount. What’s less clear is just how one measures that. How liquid does a market have to be, before we say it’s “liquid enough” to display “fair market value”?
Further, many would say that, even if liquid, markets do not display “fair market value” for each individual security listed. That is, the market may be fair overall, or for broad groups, but not for individual stocks. This really means that some individual companies are overvalued, and some are undervalued (and overall the overs and unders cancel each other out). For this reason, I would caution against reliance on one comparable company. Ideally, one would like to see 5 to 7 (or more) comparable companies, and certainly no less than 3.
Just how many is “enough” depends on many things, such as how broadly defined the industry is, or how similar or not its players are. For instance, “clothing retailing” is quite broad–selling Levis jeans differs from selling Hugo Boss jeans, and both of those differ from selling Giorgio Armani haute couture. In contrast, junior oil and gas companies, while varying from each other somewhat, are quite similar (and their market prices fall and rise roughly in unison). The more dissimilar the players are, the greater the number of comparators should be, to cause individual differences in each to “average out”. However, one must bear in mind that at some point, the players are so dissimilar that it will be argued they should not be in the pool at all. Returning to the clothing retailer example, one might build a pool of comparators that contained both Giorgio Armani and Hugo Boss, but including Levis in that same pool might be challenged.
Minority discounts
Most valuators would agree that minority interests trade, in most cases, at a value that is something less than the pro-rata share of “en bloc” value. So, if a company trades at $25/share, and has issued 1 million shares, its en bloc market value might be more than $25 million. There are reasons for this “minority discount”, the most notable being that a minority investor has limited influence on the affairs of the corporation.
Public markets are, arguably, markets of minority players. At one time, it was common to presume fairly large minority discounts were present in public trading prices, ranging from 30% to 45%.
Much research has been done on this, over several decades. There remains no consensus on what the discount might be for the market overall, let alone for individual companies’ shares. It does seem that more recent research (that of the last decade) augers for smaller discounts than was once thought. The suggestion is that, while the public market is a market of minority players, the market is really “made” by large players such as institutional investors, who hold large blocks of shares; small minority players, such as individual investors, do not influence price even in aggregate, but rather, are just riding a wave defined by those large players. However, even this research is contested.
Size differences
It is generally agreed that small companies trade at multiples lower than those of larger companies. That is, if a large company earns $1/share, has 1,000,000 shares outstanding, and trades at $15/share, making for a price/earnings multiple of 15, then a small company earning $.10/share will not enjoy the same multiple and trade at $1.50/share. There are a number of reasons for this, including:
- Equity in small (private) companies is less liquid, and thus more risky. If an adverse event occurs, a shareholder cannot readily minimize downside risk by selling his holding;
- Small companies have less access to professional management;
- Large companies, by their nature, create barriers that competitors cannot easily surpass (Warren Buffet talks of his desire to invest in a business only if it has a “moat” around it, to keep others out). Their large size makes it more difficult for others to enter their market. Consider retailing: a small shop is relatively easy to locate and set up, but to replicate the real estate holdings of GAP or Costco is not nearly so simple.
There is a fair volume of reference material that valuators often use, to adjust same-industry companies of different size to make them comparable. However, it is important to note that this data is not perfect. Most of this “size premium” data compares two public companies of different sizes (that is, companies that are both large, but with one larger than the other). The size premium data is difficult to apply when valuing private companies which are frequently smaller than even the smallest public company in a particular industry.
Conclusion
So, where does that leave us?
I believe there are two important points that come from this discussion.
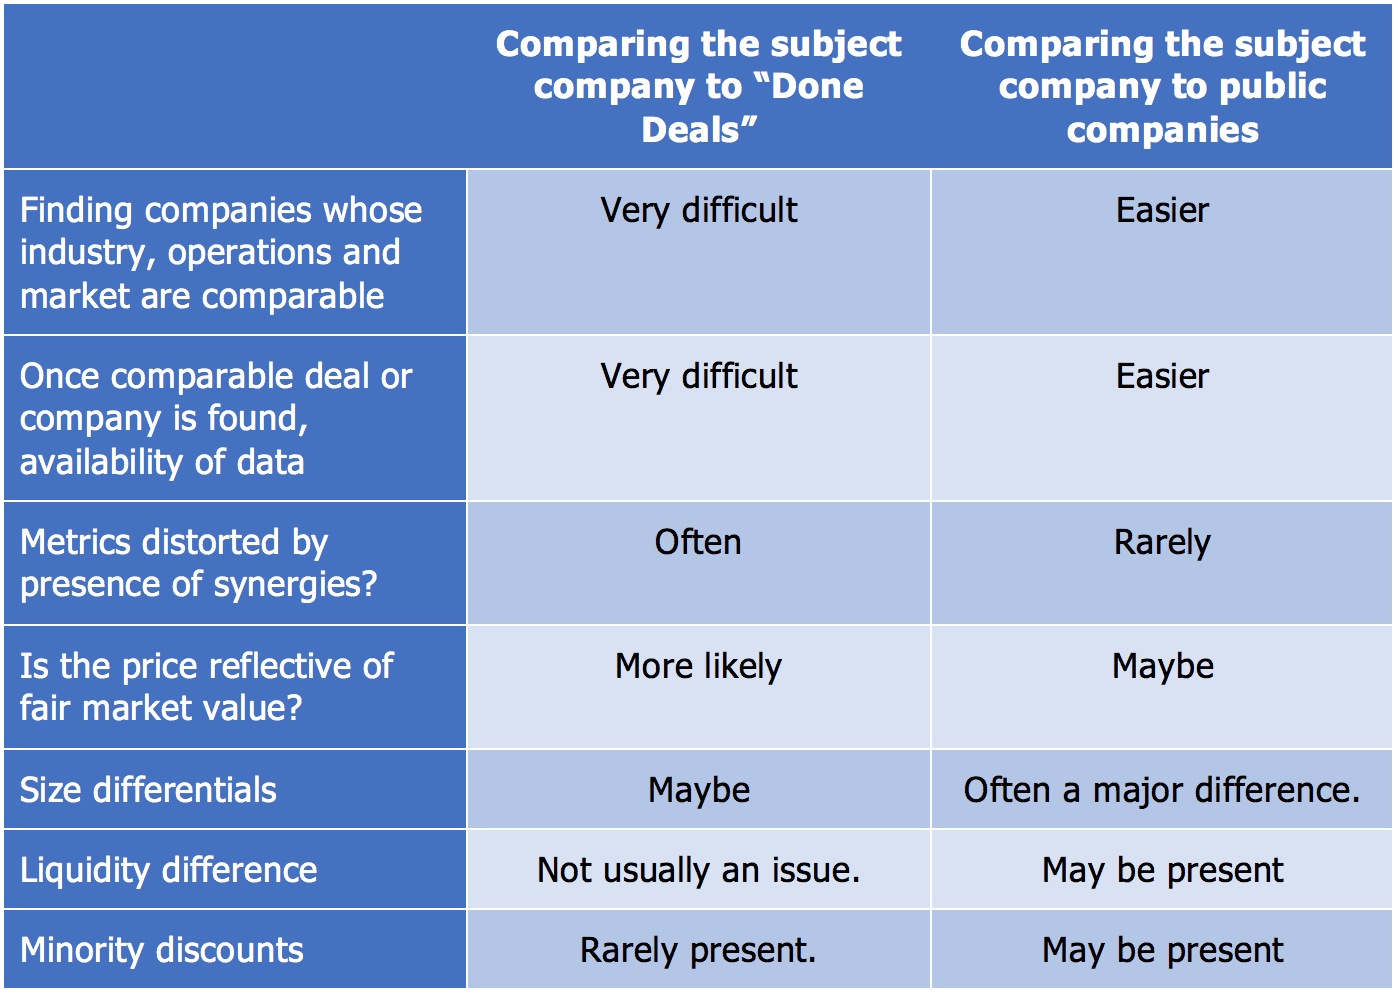
Firstly, public company comparisons overcome some of the challenges of “done deals” analyses, but present a new set of challenges and limitations of their own:
Secondly, while there may be some limited exceptions, comparable companies analyses–whether they be “done deals” or comparable public company trading multiples–are best utilized as secondary, or confirming analyses, and not as primary methods.
Instead, fundamental approaches, where a valuator relies on industry and economic data to determine the right rate of return (multiple) for this company, often with reference to industry measures, but not just stamping the competitors’ metrics onto the subject company, almost always yield a more informed opinion.